Our next step in this journey also keeps focus on a particular basic feature, without getting too hung up in the advanced details. We have learned how to create a presentation in TurningPoint. Also, we have learned how to include known participants, such as the students of a classroom, and assign them to a particular clicker (associated by ID). However, when using sessions, what good is there about knowing who your participants are during a given presentation, when you will not be able to look at the data at that time? It is possible to save a session, and look at the information later, but how can you look at the data in a meaningful way, outside of the presentation?
Reports.
Reports allow you to look at the data contained within a session under a particular view or emphasis. Since TurningPoint integrates directly into PowerPoint, it should be no surprise that the reports generated will be created specifically to be worked over within Microsoft Excel. With the power of TurningPoint, there are currently thirty-two different reports that may be generated (although two different reports will be exported as a Microsoft Word document).
This post will not provide a tutorial on all of the various reports that may be generated via TurningPoint. However, it will attempt to portray some possibilities for generating reports, and the types of potentials that TurningPoint has to offer.
Generating reports within TurningPoint is entirely dependent on one key aspect: a session. Without a session, there will be no data for which a report may be created. Once we have some session data, creating the report is relatively simple. Within the TurningPoint toolbar/ribbon, there is a 'Tools' menu, which itself contains the 'Reports' tool.
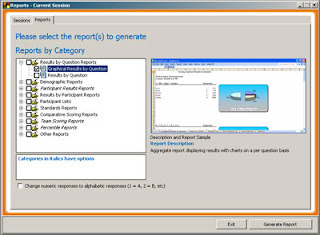
When this tool is accessed, a window will pop up, similar to a computer-based wizard. The window is split into two tabs, one for 'Sessions' and the other for 'Reports.' First, one must establish which session to work over; this may be the current session, or one may be opened (that had been previously saved). Once the session is selected, clicking on the 'Reports' tab will display the options for generating the report.
Reports in TurningPoint are separated by category. Categories simply group sets of report types that relate to each other in some way. For example, results by question, demographic, and percentile are just a few of the categories available. Within each category are the specific report types. Some reports even include generated graphs.
By selecting a particular report type, a preview image of that type will be displayed on the right hand side of the tabbed window. Underneath the preview is a description of the report type. About one-fourth of the reports also allow you to specify special options, specific to the report type. It is also possible to select multiple report types to be generated.
Suppose, as an example, that we select the first report type within the first category. This will generate a 'Graphical Results by Question' within the 'Results by Question Reports' category. To the left of the report type is a checkbox that can be marked as checked. The following image portrays this set-up:

Once the report type has been selected, a button ('Generate Report') in the bottom right corner of the tabbed window may be clicked to generate the report. Doing so may take a few moments. However, once this is done, the report will automatically be opened within Excel. An example report is presented below:

From what may be seen, TurningPoint does all the work for you when generating reports. All that is required from the user is to specify what kind of report should be made. Although simple enough to create a report, there are may advanced features that may be done when creating or working with the report. Features such as these will be discussed in some future post.
No comments:
Post a Comment