When we encountered the TurningPoint toolbar/ribbon, one tool that was mentioned allowed us to insert a slide to be used specifically by TurningPoint. Some of the features this tool allows can be fairly advanced, while this post will focus only on the basic subset of features. Several different types of TurningPoint slides may be created; we'll focus on the general graphic slides.
Creating a template for a TurningPoint slide, one group of templates is broken down into six distinct types. Namely, these are vertical, horizontal, 3D pie, distributed pie, offset, and doughnut. Each type specifically refers to the type of graph used when displaying results of clicker polling. Suppose, for example, that we choose a vertical slide. Then upon completion of polling for answers via the clickers, a vertical bar graph will display the results; it is possible to display the numerical data of the results as either percentages or quantitatively.
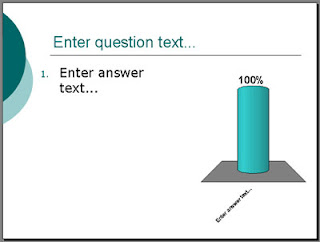
After first selecting a type of slide to insert, you will see the slide with three general sections. The first, at the top of the slide, is the question text, whose default text is "Enter question text..." In a regular PowerPoint slide, this would the the slide title (assuming it had one). On the left hand side (by default) is the list of answers for the question, for which the default text is "1. Enter answer text..." To the right of the answer is a simple single vertical bar graph, with the "Enter answer text..." on the bottom and "100%" right above. A visual representation of this default vertical slide may be something like the following:

Now that we have this basic template, establishing this slide to handle interactions with the TurningPoint clickers is fairly straightforward. First, replace the default question text with that of your own. Next, replace the default answer with your first answer, then enter in the rest of the answers in the same way as adding more bulleted items to a PowerPoint presentation. The graph will change itself as appropriate.
With respect to setting the correct answer, here is where the difference lies, depending on your version of PowerPoint. If you are using PowerPoint 2003, simply highlight the correct answer, and right click on it. Within the menu that comes up, near the bottom is an option to "Set as Correct." PowerPoint 2008, however, is fairly different. First, click anywhere within the set of answers to display an "Answer Values" panel. Drop-down lists are used to specify which answer(s) is (are) correct and incorrect.
And that is all there is to creating a basic TurningPoint slide. Future posts will delve into the more novice and advanced features that you may do. However, this first stepping stone to creating a TurningPoint slide is self-sufficient enough to help those who want to jump right in.
Enjoy!
No comments:
Post a Comment