Thursday, December 31, 2009

A first post...

Hello, and welcome to this blog, TurningPoint @ CIT. My name is Joseph B. Axenroth, and one thing I do is help professors at WSC learn about technology for in-classroom and online teaching. One such technology for the classroom is TurningPoint, an audience response system. This technology integrates into PowerPoint presentations, providing interactivity for student participants. But how is this done? And what benefits may it have for students? Perhaps more simply, what is TurningPoint?

Perhaps most simply, TurningPoint is a software and hardware system that serves as an audience response system. What this refers to is a way for presenters to allow the audience to participate, responding to the presentation. This interaction, by the audience as a whole, will help shape the way in which the presentation may go. Specifically, TurningPoint presentations must be presented within the Microsoft Office application, PowerPoint.

TurningPoint integrates into PowerPoint as a simple add-on. When installed, a toolbar will appear within PowerPoint, similar to the standard toolbar with open, save, etc. The toolbar serves as the user interface for which the user may add TurningPoint functionality to the PowerPoint presentation. This may be done on both PC's and Mac's (although currently it does not work with Mac's PowerPoint 2008).

So how does the audience respond to the presentation? As stated before, TurningPoint is both a software and hardware system. The toolbar within PowerPoint is the primary interface in terms of software. With regards to hardware, there are two primary components. One is a "clicker" and the other is the receiver (pictured on the right).

A "clicker" is the tool used by students and/or other participants in a TurningPoint presentation. It has a sequence of buttons that a user may push in response to the presentation. This response is then sent back to the receiver. Since this is the case, the two must communicate, and do so over radio frequencies (RF). A receiver may then be set to communicate on a specific channel, 01-82, defaulting to channel 41.

Using these tools, professors (or anyone) can create presentations the audience will enjoy, and walk away remembering more than presentations without. With the future of this blog, a look will be taken to determine what this technology is, who is using it (possibly with interviews), what benefits its use has over their students, and more.

The Five Steps to a Presentation Success

Before taking a closer look into TurningPoint itself, we shall first take a look at the five steps of presentation success. By taking a step into the rabbit hole, we will then be able to focus more on how we got there, and perhaps on which way to go next. In a way, this view of TurningPoint will be from a top-down approach. So with that, let us look at the five steps.

Step One: Create Presentation Slides
In order to give a presentation, it makes sense that one must first create the presentation slides, and as a result, this is the first major step. Of course, this step may be broken down further, such as planning a presentation, how it will be structured, etc. But from the TurningPoint perspective, this is the first major step.

A TurningPoint presentation itself may be initially added onto from a regular PowerPoint presentation, as opposed to building one from scratch. What differs from the two is the interactive component a person may use. As a result, PowerPoint slides will differ from TurningPoint slides in this way. In future posts, a closer look at how to create the interactive components will be taken.

Step Two: Set Up the Response Devices
As told in the previous post, the primary interface for the audience to interact with a presentation is the "clicker." Its corresponding hardware component is the receiver, which listens for responses from the clicker. In order for this communication to take place, all of the clickers must be set up to the same channel as the receiver; the channel is an integer from 1-82 and defaults to 41.

The receiver's channel may be set in the TurningPoint settings, which shall be discussed in a later post. To establish the channel for the clicker, this must be done for each one that will be used by an audience member. First, click the 'GO' button on the clicker. This will cause a little LED light to blink orange. Next, click the two-digit channel number on the clicker, such as '81' or '04.' Then, simply click the 'GO' button again. If the channel is set correctly, the blinking orange light will instead blink green. Otherwise, it will blink red (such as if the clicker is set to the wrong channel).

Step Three: Create a Participant List
With TurningPoint, as said before, the audience of a presentation is able to respond and interact. This interaction may be completely anonymous. However, sometimes, a presenter would like to know and remember what had been responded and even who responded with what. In cases such as this, a participant list is very helpful.

As an example, a professor giving a presentation may want to keep attendance. He or she may then assign a particular clicker (by ID) to a particular student, and then have the student click in any response. Or a professor may want to give a quiz in the middle of the class, and keep track of the responses from the students individually. With a participant list, complete control is provided for knowing what was responded in some part of the presentation, and also even who said what.

If a given presentation does not need to know about the audience members individually, or does not particularly care for the participants, this step may be skipped with no worry.

Step Four: Run a Presentation Session
When presenting a TurningPoint presentation, the particular setting of the presentation with the audience is termed a session. A session coincides with a group of individuals (the audience) and the presentation slides. The data collected by the presentation, through the use of the clickers, is saved within the session.

Even if a participant list is not created for the presentation, a session is still created by TurningPoint with the data collected. This data itself may even still be saved.

Step Five: Save Session Results
The last, and potentially optional, step is to save the session results. What this refers to is saving what had been responded by the audience throughout the whole presentation. Saving a session may be useful for several reasons. Attendance keeping, as an example provided before, is one such reason. Also, if a presentation was stopped in the middle, a session may be saved and reopened the next meeting if needed.

Perhaps the main reason to save a session refers to situations such that the data holding responses will be needed at a later time. This may be useful for professors who would like to know the level a class is comprehending materials during a lecture, potentially allowing more focus one some material and less on others. As a result, a much better learning experience is established for the students.

Getting to Know the TurningPoint Toolbar/Ribbon

Now that we have established the five steps to a presentation success, this post focuses on getting to know the TurningPoint toolbar in Microsoft Office 2003 and the corresponding ribbon in Office 2007. Both are essentially similar, with the primary difference being the graphical components. With the help of this post, TurningPoint in either Office 2003 or Office 2007 will become more familiar.

Starting off, let us take a quick look at the TurningPoint ribbon in Office 2007:

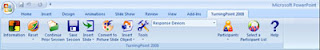
Now, look at how similar the TurningPoint toolbar is to the ribbon:

With a quick glance, both look fairly dissimilar; but with a closer look, both have the same generalized interface. Not only do both have the same generalized approach to the tools, they also include these tools in the same order. As such, it is in this order that the tools shall be discussed.

Information
The first tool provides information about the TurningPoint software, such as the version currently installed. It also allows a user to send feedback about its use to Turning Technologies.

Reset
With the Reset tool, you can reset the session for a TurningPoint presentation currently open, allowing you to completely clear data collected from the clickers. This may be done for just a particular slide (such as if you would like to re-poll a question), or for the entire presentation and/or session.

Continue Prior Session
As specified in the previous post, it is possible to save a session and continue it at a later time. To continue the session, this tool is used. It will allow you to open up a file that contains the session data.

Save Session
If it is possible to open a session, it makes sense to also be able to save a session to continue at a later time. When saving, it creates a "Save As..." type dialog box whereby you can create a name and specify a location for the session file. The name defaults to "New Session m-d-yyyy hh-mm AM" to help indicate when the session had taken place ('AM' will be replaced by 'PM' as needed).

Insert Slide
When working with TurningPoint, an interactive slide that uses polling differs from a regular PowerPoint slide. As a result, a special TurningPoint slide is needed. What makes this tool special is that it will allow you to create a TurningPoint interactive slide using several different types of templates. The available slides that TurningPoint provides will be discussed in a future post.

Convert to Picture Slide
It may be possible that when asking an audience to answer a question or opinion, you do not want to use text as answers, but images instead. Therefore, for any answer that is a part of the question/opinion, an image will replace text.

Insert Object
One tool that allows a user to interact with a TurningPoint slide on a somewhat lower level allows you to insert objects. One advantage of this tool allows you to change the type of slide currently used. It also allows you to provide answer indicators, timers, in-presentation statistics, and also a means to indicate the correct answer to a question. The main purpose of this tool is to enhance a TurningPoint slide.

Tools
Tools is perhaps the work horse that allows you to completely control several different aspects of a TurningPoint presentation. Through here, you can control the session and reports. It also allows you to access more advanced features such as comparative links and conditional branching. Comparative links allows you to view how two questions (either the same or different) compare to each other.

Conditional branching allows you to go to particular slides over other slides, depending on a condition of previous slides. For instance, if a slide contains a yes/no question, you can specify the next slide to be something different if some condition of answers specify yes as opposed to no.

Accessing the complete settings control is also accessed via tools. One may also update a receiver from a previous version, or import a TurningPoint presentation from an XML file. Possibilities exist for those who would like to export their TurningPoint presentation into a Learning Management System (LMS) such as Blackboard or WebCT.

Several of the features found under tools will be discussed in future posts in their own right.

Select Input Source
Since half of the hardware component for TurningPoint relies on the response devices, this tool allows you to work with the response device. Also, if testing out a presentation, TurningPoint can simulate randomized data, or the user can specify results by using numeric keys 0-9.

Participants
When working with TurningPoint, a presenter may want to know who s/he is working with for an audience. This tool allows you to create, import, edit, or delete participant lists fairly easily.

Select a Participant List
Similarly to the Participants tool, one can select a Participant List (after importing), so that the list may be assigned to a given session.

Display TurningPoint Help
If a user needs help with some feature within TurningPoint, s/he may use this button to bring up help, which is available through both offline and online versions.

With that, we have a generalized overview of the TurningPoint toolbar and ribbon for Microsoft Office 2003 and 2007, respectively. A more thorough look at each of the tools will be provided in future posts, with a more focused look. Other posts will also discuss the other interfaces that TurningPoint provides for the user. Potential future interviews may also provide insights as to how those questioned are using these interfaces within their presentations.

So Why Use TurningPoint, Anyways?

From the posts written so far, we have mainly been working with learning about the software/hardware components of the system. Before treading deeper into this rabbit hole, perhaps now is the time to provide a reason for using TurningPoint; we need our white rabbit to chase. Studies have shown there are several benefits to using TurningPoint in the classroom. To present the reason I am going to show, first we need to consider how people learn.

When considering conventional learning in the classroom, there are three general ways in which a student may learn: by seeing, hearing, and doing. That is, some learn by seeing the material, others by hearing it, and still others by acting on it. Some students may easily also overlap in two or three of the areas. As a result, teachers and professors would establish their lesson plans with these factors in mind. More likely than not, this presents a problem when determining how to integrate these factors into lesson plans.

To put things simply, why not incorporate a method that will teach students using all three factors simultaneously?

TurningPoint will do this for you, by its very nature. Let us consider the three factors (seeing, hearing, doing), and how TurningPoint allows a teacher or professor to incorporate them. Suppose a professor asks his or her students a question, and expects responses back from the students via clickers. Let us assume that the question asked specifically has a right answer, as opposed to being opinion-based. When polling the students is completed, the results are then displayed within the TurningPoint presentation.

The question, displayed on the screen, is the first consideration for the student to focus; when seeing the question, it is thought over by the student. After all students have answered the question, the answer (along with the students' distribution) is also displayed on the screen for the student to see. Not only are these students able to see the correct answer, but also those answers that are wrong. Students answers are displayed within a colorful chart. Visual learners will be able to understand the concept in a variety of ways, due to how they are displayed, fairly easily.

Teachers and professors may, and should, ask the question to his/her students, along with the answers one by one. Doing so will appease the auditory learners. Students, when they hear the question, will be able to ponder the answer from those provided. Doing so will engage their auditory focus in the way they consider each answer, as that is one way in which the information was provided. When the results are displayed on the screen, discussing which answer was correct (and perhaps why) will help the auditory learners to understand the concept.

Lastly, we have the 'learn by doing' approach, and this is where the clickers come into play. After the question is asked, the student considers the answer from the choices provided. Which ever choice they provide as an answer is re-enforced by the clicker when s/he pushes a button. The student, then, is acting on the material, if only loosely.

What results in the end is that students walk away from the lecture understanding the material better, due to the fact that all three factors are used simultaneously. After all, isn't a better learning experience for the student (so he or she is able to understand the material more clearly and completely) a key aspect to teaching? This post considers the notion speculatively, but an empirical result should be considered in a future post.

Creating a Basic TurningPoint Slide

In order to get our feet wet with this, perhaps now is the time to introduce the ability to create TurningPoint slides. What a TurningPoint slide contains over a regular PowerPoint slide is the ability to receive feedback from the audience. This may be said easily enough, but what exactly does this mean, from the slide perspective, and how is it done? Answers to these questions shall lay the focus for this post.

When we encountered the TurningPoint toolbar/ribbon, one tool that was mentioned allowed us to insert a slide to be used specifically by TurningPoint. Some of the features this tool allows can be fairly advanced, while this post will focus only on the basic subset of features. Several different types of TurningPoint slides may be created; we'll focus on the general graphic slides.

Creating a template for a TurningPoint slide, one group of templates is broken down into six distinct types. Namely, these are vertical, horizontal, 3D pie, distributed pie, offset, and doughnut. Each type specifically refers to the type of graph used when displaying results of clicker polling. Suppose, for example, that we choose a vertical slide. Then upon completion of polling for answers via the clickers, a vertical bar graph will display the results; it is possible to display the numerical data of the results as either percentages or quantitatively.

After first selecting a type of slide to insert, you will see the slide with three general sections. The first, at the top of the slide, is the question text, whose default text is "Enter question text..." In a regular PowerPoint slide, this would the the slide title (assuming it had one). On the left hand side (by default) is the list of answers for the question, for which the default text is "1. Enter answer text..." To the right of the answer is a simple single vertical bar graph, with the "Enter answer text..." on the bottom and "100%" right above. A visual representation of this default vertical slide may be something like the following:


Now that we have this basic template, establishing this slide to handle interactions with the TurningPoint clickers is fairly straightforward. First, replace the default question text with that of your own. Next, replace the default answer with your first answer, then enter in the rest of the answers in the same way as adding more bulleted items to a PowerPoint presentation. The graph will change itself as appropriate.

With respect to setting the correct answer, here is where the difference lies, depending on your version of PowerPoint. If you are using PowerPoint 2003, simply highlight the correct answer, and right click on it. Within the menu that comes up, near the bottom is an option to "Set as Correct." PowerPoint 2008, however, is fairly different. First, click anywhere within the set of answers to display an "Answer Values" panel. Drop-down lists are used to specify which answer(s) is (are) correct and incorrect.

And that is all there is to creating a basic TurningPoint slide. Future posts will delve into the more novice and advanced features that you may do. However, this first stepping stone to creating a TurningPoint slide is self-sufficient enough to help those who want to jump right in.

Enjoy!

Focusing in on the Participants

So with a little practice, we should now know enough to build a relatively simple TurningPoint slide. But building the slides for which your audience shall provide input is half the battle. The other half revolves around knowing, perhaps only anonymously, who the participants are. TurningPoint, as had been stated from the very beginning, is an audience response system. With this post, we shall look into a little of what can be known of (and done with) the audience.

When we had previously discussed the TurningPoint toolbar/ribbon, one of the tools pertained to working with participants. As had been stated, this tool allows you to create, edit, import, or delete participant lists. The participants within this list may potentially be associated with a particular clicker, designated by the clicker's ID. Let us then focus on how to interact with this participant list, and the potential for associating clickers to them.

Creating a Participant List
Under the Participants tool menu, one of the options available allows you to create a participant list by means of a wizard. When using the wizard, you may choose one of four different participant list templates: education, corporate, available fields, and custom. Education specifically correlates with participant lists involving students, while corporate correlates with business. Available fields templates allow you to choose from any field that has been defined for use within TurningPoint, either by default or from the user. Custom templates allow you to create the template from scratch.

Once you have defined which template and relating fields to use for your participant list, you may then create groups. By using groups, you can split up your participants for demographic and team purposes. With respect to creating a participant list, this step is entirely optional. However, depending on the context of the participant list and planned sessions, creating groups may be a good (perhaps even necessary) idea.

Next, simply name the participant list, so that it may be saved and reused for subsequent sessions. Upon doing so, clicking 'Finish' will allow you to edit the list. But before discussing how to edit the newly created list, potentially you may instead want to import this list.

Importing a Participant List
Importing a participant list is as simple as opening a file--in fact, this is exactly what you will be doing. By selecting the participant menu option to import the list, an open file dialog box is displayed. Defaulting to a 'Participants' folder, this option is looking for a *.tpl or *.tpp file; this file is formatted in a particular way for TurningPoint to know it corresponds to a participant list. Open the file, and a new window will open up for editing the list.

Editing a Participant List
After creating or importing a participant list, it should not seem so surprising that you can (and most likely will) edit this list. To do so, a window will be displayed housing a table of fields; in particular, those fields specified when creating the list. By default, the first field in the table will refer to the device (clicker) ID. On the back of a clicker is the ID for it; entering the hexadecimal value in the spot for this field will then assign it to the corresponding student.

Discussing what can be done with the participant list within the window may take a whole post in itself, and most likely will in the future. What is important to note for the time being is that you can add participants in much the same way as you would interact with an Excel spreadsheet. In fact, the window also allows you to import a participant list from an Excel spreadsheet.

Deleting a Participant List
There may come a time, such as the end of a semester, in which you would like to delete a participant list. TurningPoint allows this feature for a clean delete. Deleting the corresponding file for the participant list will result in the same way; however, as a convenience factor, you may delete the list from within TurningPoint itself. When you choose this option, a window will display all of the participant lists TurningPoint knows about. Click whichever list, and then click the 'Delete' button. Simple as that.

One of the most beneficial uses for a participant list is reflected in the reports that TurningPoint can generate for you. Reports shall be discussed in a future post, since they are a little bit more advanced. However, by "knowing" who your participants are, the reports will provide an abundance in meaningful information for assessing the knowledge of the participant.

With that, we have a little of the how for participant lists, along with a fragment of the why. Both aspects shall be discussed further as needed. Next week, however, the post shall provide a use case of TurningPoint within WSC.

TurningPoint at Westfield State College

The TurningPoint @ CIT blog title portrays exactly what it is about. Most specifically, it revolves around TurningPoint use through CIT. Some professors at WSC have been using TurningPoint. This post focuses on one professor named Mike Young, the department chair for Physical Science, and a little of his adventures with the system.

Keeping things simple, I asked Mike five questions. Collectively, the questions pertained to the how and why of his using TurningPoint. Although the interview is outlined below, statements are paraphrased.

JBA: What motivated you to start using TurningPoint?
MY: I had read about the use of clickers in physics and astronomy classes, which I thought sounded like a good idea. Research suggested they had been effective; in those types of classes, at least.

JBA: Do you observe an improvement in your students' learning of the material?
MY: Well, I haven't done any actual analysis, but generally, yes. Seems useful in helping students to recognize what they know or don't know.

JBA: Are you ever surprised at the results of polling? For instance, seeing your students answer in ways you didn't expect?
MY: Yes. Sometimes I expect some answers not chosen by the students, but then turn out to be a common response. So this is helpful for me, too, to figure out what they know, or what their misconceptions are, and what I thought they know. The difficulty lies in guessing what those misconceptions are beforehand.

JBA: Would you recommend to other professors to start using TurningPoint? Why or why not?
MY: In some classes, it's useful. For example, astronomy for the concepts it has. I think in some courses, it might not work as well. But for the sciences in particular, it seems to work out. Asking questions that the students would answer based on memory doesn't really add much. But asking questions where the students have to apply concepts works out well.

JBA: Would you consider testing your students with TurningPoint?
MY: I may consider it, but generally I have stuck with the basics of TurningPoint, so making sure who has what clicker and other features would have to be factored in first.

Although these were the questions that I had asked Mike, he provided me with more feedback. One of the ideas about TurningPoint he feels is most useful is that it provides an excuse to have students talk to each other about the material. Particularly, to discuss concepts thought over in the clicker-based questions. Overall, this helps to break up the lecture some, and keeps students' attention span.

Within WSC, this post shows that TurningPoint very well may be a good choice to help students learn, and to help keep them engaged with the material. The end result? Students are provided with a better learning experience. Not only this, but professors are also provided with a better tool for assessing their students conception of the material.

A Note on Reporting

Through the young life of this blog, we have discovered the basics of creating a TurningPoint presentation, including how to involve participants. Piece by piece, as we unravel what this system is, how to use it, and even why to use it, we have taken somewhat of a top-down approach. We have kept to the basics, providing an overview of the general aspects of the many tools that may be used.

Our next step in this journey also keeps focus on a particular basic feature, without getting too hung up in the advanced details. We have learned how to create a presentation in TurningPoint. Also, we have learned how to include known participants, such as the students of a classroom, and assign them to a particular clicker (associated by ID). However, when using sessions, what good is there about knowing who your participants are during a given presentation, when you will not be able to look at the data at that time? It is possible to save a session, and look at the information later, but how can you look at the data in a meaningful way, outside of the presentation?

Reports.

Reports allow you to look at the data contained within a session under a particular view or emphasis. Since TurningPoint integrates directly into PowerPoint, it should be no surprise that the reports generated will be created specifically to be worked over within Microsoft Excel. With the power of TurningPoint, there are currently thirty-two different reports that may be generated (although two different reports will be exported as a Microsoft Word document).

This post will not provide a tutorial on all of the various reports that may be generated via TurningPoint. However, it will attempt to portray some possibilities for generating reports, and the types of potentials that TurningPoint has to offer.

Generating reports within TurningPoint is entirely dependent on one key aspect: a session. Without a session, there will be no data for which a report may be created. Once we have some session data, creating the report is relatively simple. Within the TurningPoint toolbar/ribbon, there is a 'Tools' menu, which itself contains the 'Reports' tool.

When this tool is accessed, a window will pop up, similar to a computer-based wizard. The window is split into two tabs, one for 'Sessions' and the other for 'Reports.' First, one must establish which session to work over; this may be the current session, or one may be opened (that had been previously saved). Once the session is selected, clicking on the 'Reports' tab will display the options for generating the report.

Reports in TurningPoint are separated by category. Categories simply group sets of report types that relate to each other in some way. For example, results by question, demographic, and percentile are just a few of the categories available. Within each category are the specific report types. Some reports even include generated graphs.

By selecting a particular report type, a preview image of that type will be displayed on the right hand side of the tabbed window. Underneath the preview is a description of the report type. About one-fourth of the reports also allow you to specify special options, specific to the report type. It is also possible to select multiple report types to be generated.

Suppose, as an example, that we select the first report type within the first category. This will generate a 'Graphical Results by Question' within the 'Results by Question Reports' category. To the left of the report type is a checkbox that can be marked as checked. The following image portrays this set-up:


Once the report type has been selected, a button ('Generate Report') in the bottom right corner of the tabbed window may be clicked to generate the report. Doing so may take a few moments. However, once this is done, the report will automatically be opened within Excel. An example report is presented below:


From what may be seen, TurningPoint does all the work for you when generating reports. All that is required from the user is to specify what kind of report should be made. Although simple enough to create a report, there are may advanced features that may be done when creating or working with the report. Features such as these will be discussed in some future post.

Setting TurningPoint to Work As You Like It

During our experiences with learning about the TurningPoint technologies, I have already said that we kept the material basic so far. We are soon to reach the level for which we can start learning a little more advanced features about the technology. However, before doing so, we should take a look at some of the various settings one could use with the software.

Typically in software, the characteristics and behavior is controlled by the way it has been developed. In some software, these characteristics and behavior may be modified to suit the liking of the user. An easy example for which is changing the font family and size in a word processor. The set of the characteristics and behavior may be considered as being that software's settings. With the many features that TurningPoint has to offer, it should come as no surprise that it allows you to control many settings.

When we discussed the TurningPoint toolbar/ribbon, it had been stated that the settings may be accessed via the 'Tools' tool. Once accessed, a window will pop up looking similar to the following (taken from PowerPoint 2003):


The window itself is relatively simple. It contains two tabs, 'Settings' and 'Polling Test.' The Settings tab allows access to the interface for changing various component and presentation settings. The Polling Test tab allows access to test the TurningPoint receiver; I find that it is good practice to test the receiver with a few clickers before giving a presentation.

TurningPoint allows you to change the settings for both the response device (receiver) and the presentation. Both paths include views for just common settings, to change those settings most commonly used, or all settings.

When working with the response device settings, there are two that you "should" change, depending on the environment you will be using them. First corresponds to the channel for which the receiver will base its communications on. The default channel is 41. However, if another session is close enough (approximately 500 feet radius) during the same time, and both receivers are set to channel 41, both receivers will get responses from the clickers in both areas.

The other response device setting that you "should" change is the number of expected devices (clickers). The default value is 25. However, a presentation will most likely include more or less than this value. Making changes to the response device settings will be saved within the device itself, to be used within other systems with TurningPoint.

Potentially the bulk of the settings that may be changed exists for the presentation. These settings correspond to the TurningPoint presentation currently open. As they are presentation-level settings, they will be be contained within the presentation, even if used on a different system with TurningPoint. For this post, I will discuss a few of the options available with the presentation's common settings.

If you use TurningPoint fairly often when using PowerPoint, one setting allows you to start TurningPoint anytime that PowerPoint is loaded, as opposed to having to start the software separately. By setting the 'Add-In Always Loaded' option to 'True' this will allow the software to always start up with PowerPoint. This setting option may be found in the 'Misc' category of the presentation settings.

It is easily possible that professors will find they like some chart types more than other chart types. On such cases, a setting allows the user to set up the default chart type to use, instead of having to always change the slide to use that chart type. Under the 'Chart Settings' category, an option for 'Standard Chart Type' allows you to change this, defaulting to the vertical chart type.

When establishing the presentation's settings, there are several categories that divide up the types of changeable settings. These include answers, charts, competition, fill in the blank, misc, racing leader board, response reminders, and showbars. Since many of these areas we have not yet discussed, the corresponding settings will not yet be discussed.

From here, we are now at a point where we have covered some of the basics on TurningPoint. We know how to create a successful presentation, what the TurningPoint toolbar/ribbon is all about, basic slides, participants, and reports. We have even spent a post on why a teacher or professor should use TurningPoint.

Where do we go from here? That, my friends, is to be left for next week's post.

To Follow in the Steps of Others

Let us take a step back, and consider a few things for a moment. The purpose of this blog may fall into two generalized categories. First is an attempt to teach the various aspects of the TurningPoint technology, or the what and how. In addition is the potentially most essential question, why?

Why should presenters use this technology?

Throughout the life of this blog, I have started, and will continue, to provide reasoning. However, with this post, I am going to share some pedagogical approaches to the technology as discovered by others. Much research has been established over the past several years regarding this type of technology, including attempting to discover the benefits of using TurningPoint. I will now present a few of such research articles and web sites, providing a short overview of each.

Students Who Use "Clickers" Score Better on Physics Tests
With this article, a focus is taken on how using clickers in the classroom has specifically helped physics students. The professor making use of them for this course is named Bill Reay, based at Ohio University. Some of his results may be a little surprising to some. For instance, it may or may not be surprising that his students' final exam grade went up a full letter grade. Also, which he provides speculative reasoning, is that his female students' grades had a greater increase. Bill effectively makes use of TurningPoint, whereby his questions focus on whether students can apply concepts as opposed to querying whether they simply remember terms and facts.

TurningPoint Student Response System
The next article is written by Victor Edmonds, director of Educational Technology Services at the University of California-Berkeley. His main focus corresponds to how the technology has grown over the past several years, in both performance and cost, and that if used properly can be a very effective tool for learning. One point he also makes is how easy deploying the technology into the classroom can be. Also, he speculates that the TurningPoint software has very many features, several of which he thought he wouldn't use--but they're there should he ever feel the need to. He also notes that Turning Technologies offers several trainings on how to use their software via their web site. When the article was written in 2004, there had not been any support for the Mac; today, there is support for Mac by using TurningPoint Anywhere or PowerPoint 2004.

telr clickers
Ohio State provides a fully featured web site through their Technology Enhanced Learning and Research (telr) web site. Similarly to this blog, the web site focuses on not only what are clickers, by why professors should consider using them. An overview is provided for the installation and deployment of the clicker software, namely TurningPoint. What I think separates this third-party web site from others that I have found, is they provide excellent teaching ideas for incorporating TurningPoint into fifteen areas of study, as diverse as agriculture, business, communications, and nursing. They also provide pedagogical reasoning for designing questions specifically for effective use within TurningPoint. Also, the web site provides seventeen articles and web sites about the research done regarding clickers.

Student Response Systems
At the University of Minnesota, a short web-based article provides several outlooks on the clicker-based technologies. As with many other articles and web sites, a basic definition of what a student response system pertains to is presented. An outline of the educational uses follow, although it does not go into detail. One of the things the article does go into detail are the issues involved with the technology, focusing on instructional, accessibility, and technical issues. One example is then provided, specifying how Donald Lui uses the technology in his large (110 or so students) economics class. Several resource and research articles and web sites are then provided to specify how various clicker technologies are used in practice.

7 things you should know about...Clickers
The last article I am going to share for this post is from EDUCAUSE. It is a two page PDF document. Beginning with a scenario, a girl attends her General Chemistry lecture-based class, holding more than 400 students. From there, it poses seven questions, providing snippets of answers. It explores what it is, and who's doing it. Then it considers what makes clickers unique. EDUCAUSE then portrays why they feel it to be significant. Next, like some other articles, it explains the downside of using clickers, mostly only focusing on the cost. Lastly, it wonders where the technology is headed, and what implications it has for both teaching and learning.

This post essentially sought to share what other people in the clicker community have been doing. Not just with TurningPoint, but also the technological and pedagogical aspects of clickers in general. Hopefully, with an overview of both this blog and the articles / web sites presented in this post, there will be more of a chance to see the benefits of using clicker technology in the classroom.

Slight Enhancements to the Basic TurningPoint Slide

At this point, we should know how to create a basic TurningPoint slide, at the bare minimum. However, there are more basic results that we can discuss with respect to the slides, and this post will address those. When we discussed the TurningPoint toolbar/ribbon, slides also have the potential to include various object types. Some of these object types will be included. Other slide types not discussed thus far will also be included.

Previously, we have focused on slide questions that have a definitive correct answer among a group of choices. However, it is perfectly reasonable to include opinion-based slides, in the form of Likert-based opinions of 4, 5, or 7 options. There are also True/False, Yes/No, and Yes/No/Abstain slide types. As a general template, you can specify a 2-10 answer slide, which may correspond to either definitive answers or opinions.

Suppose, for instance, that you are using TurningPoint clickers in your classroom, and your audience has never before experienced how to use them. Luckily, TurningPoint offers 'Ice Breaker' slides in the form of either analogies or word scrambles. Ice breaker slides are considered to be a best practice by Turning Technologies. It auto-generates an analogy for you, should you choose. If, on the other hand, you choose a word scramble, then you would choose which word (greater than two letters) to scramble. Every other letter is then taken out, and each answer choice represents potentials for the missing letters. The following image portrays the word scramble, with the word choice corresponding to 'Pennsylvania.'


TurningPoint offers many other slide types to use, several of which correlate with teams. Examples include assigning a team, team leaders, point wager slides, fastest responders, and others. Future posts will touch base with these more advanced slide types.

As I have said, there are various objects specific to a TurningPoint presentation that may be used. I will focus on four here, namely 'Answer Now,' 'Countdown,' 'Response Counter,' and 'Correct Answer Indicator.' Since these types of objects are enhanced versions of PowerPoint objects, you have the ability to format them in the same exact way (such as to conform to a color theme you have chosen).

The 'Answer Now' object type makes use of a fairly straightforward idea. With twelve variations, 'Answer Now' objects are a good way to let your audience know when you expect them to answer a question, and helps to set apart your TurningPoint slide from a PowerPoint slide.

When paired up with a 'Countdown' object, the audience will know exactly how much time they have before polling of an answer will be closed. The time can be specified by the presenter, and a default value can be changed within the TurningPoint settings. Eleven variations allow for a customizable timer.

In contrast to counting down time, you also have the ability to count up with respect to the number of responses received. Six variations provide a visual indication for how many participants have provided an answer. This visual indication works for not just the presenter, but other audience members as well.

Lastly, the 'Correct Answer Indicator' helps your audience members know which answer was correct given a definitive list of choices. After the answer polling is finished, when the results are displayed to the presenter and audience, a visual is displayed to indicate which of the choices correlate with the correct answer. If using an opinion-based polling, then one may still use the indicator to specify what the presenter chose as his or her choice.

This post sought to portray some of the slight enhancements one can make with a TurningPoint slide. Some of these enhancements also include best practices to use within a presentation. Future posts will add on to the explanations provided here, with more focus toward some particular result.

Learning About TurningPoint...

In both the technological and pedagogical approaches, we have been attempting to learn about TurningPoint. At the Center for Instructional Technology on Friday April 24th, I presented a basic training that gave a general outline in these respects. This post will provide a summary of what had been covered. An overview of the presentation conveyed three questions whose answers were sought during the session. First, what is TurningPoint? Also, how can the technology be used, particularly in the classroom. In doing so would lay the most important question, why should this technology be used in the classroom?

TurningPoint is both a software and hardware system created by a company called Turning Technologies. From a basic standpoint, it serves as an example of an Audience Response System (ARS), Student Response System, or Classroom Response System. Response systems allow for interactive presentations for which the audience is able to respond to the presentation. Any given presentation is termed a session, for which the data may be saved for later review. Participants in sessions may be anonymous or known, although participant lists would have to be compiled beforehand. The TurningPoint software is typically integrated into Microsoft Office as an add-on.

As I have said, TurningPoint serves as both a hardware and software system. With respect to the hardware, it is divided into two subgroups. The first subgroup is the clicker set. Each clicker is small, lightweight, and easy to use, and it serves as the main interface to polling audience answers. Paired with a clicker set is the receiver. By plugging into a computer via some USB port, it uses radio frequencies to listen to the clicker set responses, feeding them into the presentation in real time.

Forming a symbiotic relationship to the hardware, the TurningPoint software integrates into Microsoft Office. It serves as a toolbar in PowerPoint 2003 (or a ribbon in PowerPoint 2007). Formatted questions have the option to be imported from Word. A session's data may be generated as a report and exported into Excel. However, availability for the Mac is somewhat limited, and is only offered in Office 2004; those with Office 2008 can use TurningPoint Anywhere.

Once a handle has been acquired on what TurningPoint is and how it works, one would most likely want to know how it can be used within a classroom setting. One of the most beneficial ways TurningPoint can be used is as a means for assessment in real time. It allows the professor to know which course material should be covered more, or even less. As a result, learning will become more personalized and teaching will lose its grip on a 'one-size-fits-all' approach. This technology can also be used to increase attendance and most certainly participation.

TurningPoint, and other ARS's, have benefits for both professors and students. For a professor, the system will help to clear misconceptions over students' understanding of the material. It can also help to emphasize topic points covered during class lectures, to help break up the lecture. In some cases, the professor may also find that it provides students' with a reason to discuss concepts with each other (as an example of peer instruction).

It has been shown that students' grades may improve, particularly in final exam grades by a full letter grade. One side effect of using TurningPoint is that it helps keep students focused and engaged in the material; in a sense, it makes learning fun. Due to the nature of peer pressure, participation is also encouraged as student responses will be anonymous (although the responses will be shown for the class as a whole). Just as the system helps professors to assess students' conceptions, the student his or her self will be able to more correctly assess the ability of understanding the material.

As with everything in this life, there is both the good and the bad. Although there are very many benefits for using the technology, there are some drawbacks. Most likely, it will take some time to pass out the clickers and poll students for answers to questions. Also, to be more beneficial, it may take some practice at the art of creating meaningful questions to be used in the clicker-based classroom setting. For instance, it may not be as beneficial to poll whether students can remember facts. But it would be much more so to poll whether students can apply some concept in a different setting.

Although this post summarized the main topics and points of a recent TurningPoint training, it also has provided some good review on some of what has been discussed thus far in the life of this blog. Included were both the technological and pedagogical aspects. The training provided an hour look of the what, how, and why of TurningPoint, and a small view of the answers have also been provided within this post.

Beneficial Use of Audience Response Systems

I have in recent weeks been working on researching the pedagogical and beneficial uses of audience response systems. Many of the articles I have read included comments from teachers and/or professors who, although had never tried using an audience response system, did not see them as a useful tool. The arguments typically revolve around the notion that students' low attention span should not be appeased by technology and mere button pushing. In a previous post, I had discussed some reasoning behind why one should use TurningPoint; this post will continue with more reasoning.

"Like any technology, these systems are intrinsically neither good nor bad; they can be used skillfully or clumsily, creatively or destructively. However, they can produce results that are eye-opening and potentially of great value to both students and instructors for enhancing the teaching-learning process" (Clickers: A Teaching Gimmick that Works).

Audience Response Systems, perhaps in their most basic form, are tools; as such, they must be used properly in order for benefits to be known. A shovel is a very beneficial tool for digging, but if it is used to screw in a screw, the benefits will not be known. The question that should then arise is, in what ways will use of the technology be beneficial to learning?

Research on using audience response systems from a pedagogical perspective mention the Mazur Group from Harvard, and the notion of using peer instruction. Peer instruction is a technique for which students discuss a particular concept in class with their neighbors. It can be used to spark an entire class discussion. Primarily, it is used to engage students in the lesson. When paired with TurningPoint, a powerful combination is formed.

The typically described scenario works as follows. A professor polls his/her students to determine whether they are following the material. On the cases in which students' answers diverge, the professor may then ask the students to discuss amongst each other why they believe their answer was correct. Then, the same (type of) question is re-polled. From here, a class-wide discussion may then take place to determine which answer is correct and why.

By using this approach, granted the students' attention spans are appeased via technology and button pressing, they are actively learning using this method as opposed to passively learning in a more traditional lecture setting. As students are more active in their learning process, a greater sense of communion is established within the classroom. Lectures lose the monologue characteristic, and become more of a dialogue between the professor and students. With the use of TurningPoint, the dialogue may not always be verbal, but an explicit bi-directional communication is developed during the class session.

So why is this important? Why not just lecture and let the student absorb what is taught? He or she should be working to understand the material, or fail (comment #3).

As someone interested in internet-based technologies, this reminds me of the internet communications protocols TCP (Transmission Control Protocol) and UDP (User Datagram Protocol). With UDP, the protocol can be used for essentially broadcasting messages; it does not make a check to be sure the recipient of the message actually receives any part of it. TCP, on the other hand, makes several checks to be sure the recipient will be able to, and does, receive the entire message in full.

Simple lectures that typically broadcast a lesson act similarly to the UDP protocol. There is no exact means of determining who is absorbing the material, nor how much. By using TurningPoint, however, along with peer instruction, a lesson can become more akin to TCP. In real-time assessment, a professor may know the material was not absorbed by most of the class, going over the concept(s) again to be sure the whole class is able to understand.

Many uses of TurningPoint during a presentation can be found to be beneficial towards better experiences for both presenter and audience, even outside of a classroom setting. However, within the classroom (not necessarily higher education), using TurningPoint with peer instruction has been shown to increase students' actual learning.

To finish this post, I pose a (not so) simple question. Is it better to broadcast a lecture as a soliloquy, or immerse your students in an actively engaged classroom setting?

To Pose a Question

When thinking about what I should cover for this post, I pondered on this question for a fair amount of time. And as I focused on this question, it soon made sense to me to write a post that itself focuses on questions. In particular, focusing on the questions one should be asking when using an Audience Response System, such as TurningPoint. Previously, I described how to create a TurningPoint slide to incorporate a question (or opinion). Now we delve into creating the questions themselves.

The primary purpose of using clickers in the classroom is to promote a better learning experience. Typically, clickers allow a teacher / professor to 'engage' their students in the material; it is entirely necessary for the student to be actively thinking about the material. From various articles and papers that I have read, one way to get your students actively thinking about course content is to devise good questioning.

It has been argued that designing effective questions for classroom response system teaching (PDF) is an important aspect for student understanding. The abstract for their paper is presented as follows:

Classroom response systems can be powerful tools for teaching physics. Their efficacy depends strongly on the quality of the questions. Creating effective questions is difficult and differs from creating exam and homework problems. Each classroom response system question should have an explicit pedagogic purpose consisting of a content goal, a process goal, and a metacognitive goal. Questions can be designed to fulfill their purpose through four complementary mechanisms: directing students’ attention, stimulating specific cognitive processes, communicating information to the instructor and students via classroom response system-tabulated answer counts, and facilitating the articulation and confrontation of ideas. We identify several tactics that are useful for designing potent questions and present four "makeovers" to show how these tactics can be used to convert traditional physics questions into more powerful questions for a classroom response system.

The authors see the development of clicker questions as so important that their approach has been termed 'question-driven instruction' and has been diagrammed (from the same paper):


The model differs slightly from Eric Mazur's Peer Instruction model, which the authors claim is an 'inversion of the paradigm' he uses. Instead of posing clicker questions to reinforce small lectures forming the core, the questions themselves form the core of the class. Within this model, students go over any necessary materials on their own beforehand, either via readings, homework, or some other means. Class time is then focused around what the authors term as a 'question cycle.'

Question cycles are developed as follows. Starting off, a question is posed to the students, who may not yet even know the material needed to answer the question. From here, answers may be polled via the clickers, although the model does not necessarily require this step. Instead, small group discussions may take place (akin to the peer instruction) before polling answers. Thus far, the professor / teacher has not lectured or stated any material relevant to the question; all is discussed by the students, among the students. Discussions could potentially result as class-wide, in addition to small groups.

Correlating with the diagram, the authors take note of three general parts to the cycle. First pertains to posing the question itself, specifying that questions need to be challenging, but not overbearingly so. Next, discussions within both small groups and the class as a whole are imperative to the model's learning process, whereby polling of students occurs afterward. Last revolves around the idea of 'agile teaching,' in which the instructor responds appropriately to the polling and discussions.

What should result from the cycle is a deeper understanding of some fundamental concept of the material. Simple memorization of facts should not take place here, and the concepts covered could be used in future homework, exams, clicker questions, or some other relevant application. For this method to work, however, the design of devising the questions themselves is entirely critical.

Much of the rest of the paper describes a framework for how to design such questions, more appropriately from a pedagogical perspective. Although the context of the questions described (as examples) are associated with physics classes, explanations are provided in such a way that generalize the approach. One important distinction the authors make is what distinguishes a good clicker-based question under this method, as opposed to good exam questions; they stress that what may be good in one context will not necessarily be good in another, a common mistake some instructors make.

When designing clicker-based questions, they argue, three pedagogical approaches should be taken. The first focuses on the content, or what the question should pertain to. Next exemplifies how the question or problem should be solved. And third revolves around the why for looking at the question, particularly in some specific view. By focusing on these three approaches to designing clicker questions, the instructor should simply 'guide' the students into understanding of the material. The paper provides several various 'tactics' on how to design the questions to guide students in specific directions.

Designing effective questions for classroom response system teaching provides an interesting look at posing questions as the core of using clickers. The paper was written to 'address the need of a comprehensive or systematic framework for developing and evaluating CRS questions.' It is a highly valuable read for any who create and/or use clicker questions in the classroom.

A Technical Post on a "What If?"

It's been a while since I've written a post, stretched between several various projects. However, I have been thinking of what I had wanted to write in this post. As many of the recent posts have focused around the pedagogical aspects of using TurningPoint, I wanted to consider some technical aspects. What will make this post different is that it proposes a 'what if?' scenario, as opposed to focusing on a current set of features.

Relatively recently, Microsoft released a technical preview of Office 2010. It is natural to assume that Turning Technologies will incorporate features for TurningPoint use at some point during this suite's life. One of the key ideas that progresses the new Office forward is its integration with web-based versions of some of the applications, one of which is PowerPoint (in a direct competition with Google Docs).

So, what if TurningPoint included an add-on for the web-based version of PowerPoint in addition to the stand-alone desktop version?

To provide my perspective on the idea, I present two follow up questions. First, how could this be possible? Second, what implications (both good and bad) may this have? By no means could I provide an exhaustive explanation, yet I can think of some potential ideas.

From an outside perspective, integration of TurningPoint in the web-based version of PowerPoint seems plausible, especially in a 'Web 2.0 era.' Obviously, there will be some difficulties, particularly communications between the receiver and the web browser; this I see as the main trouble maker, due to JavaScript's security settings.

Yet I don't think that the creation of the TurningPoint slides will be much of an issue, though. With TurningPoint 2008 v4.1, Flash-based graph support has been included, which itself is a web-based technology. SVG could also be used to build static graphs, although this would not include easily implementable interactivity with the graphs. Also, TurningPoint can extend the web-based functionality contained within PowerPoint. Since this functionality itself needs to be interactive, graph support could be included to be as interactive (if not more so) as TurningPoint currently stands.

If formatted correctly, TurningPoint can import data in varying types, one of which includes an XML document. Once the XML document is parsed, it can be understood as a TurningPoint presentation, whereby using XSLT or some other related technology, an appropriate server can output the (X)HTML document (more likely some data structure, possibly in JSON) the web-based PowerPoint can interpret.

With respect to the web-based versions of Office 2010, will Microsoft allow the creation of 3rd party widgets (toolbar, ribbon, or whatever else Microsoft comes up with for their GUI), or will they only be allowed specifically for the desktop variants? With the Web 3.0 mash-ups of web documents and applications, I see no reason for Microsoft not to allow these web-based widgets. In fact, if web-based widgets were allowed to be integrated into the web-based Office, this will give Microsoft a huge leg up on Google Docs. Then again, it's Microsoft, so who knows?

Supposing that there could exist a TurningPoint implementation for the web-based PowerPoint 2010, what then? What benefits or drawbacks could this portray?

First and foremost, all Office 2010 web-based applications will be relatively limited compared to their desktop versions. This obviously will have huge implications on a web implementation of TurningPoint, with respect to how much Turning Technologies themselves could implement in their web version. As such, the web-based implementation could simply be a 'Lite' version.

However, there is one key factor that involves the whole notion of web-based software. As long as you have an internet connection (and also an appropriate browser), you will have access. Simple as that. No installation by various IT departments. Start a class, direct your browser, open your presentation, done.

Of course, there will be drawbacks. In order to use the web-based Office suite, you need a Microsoft Live account. This isn't necessarily a bad thing, especially since documents created will be stored (I'm assuming) on a Microsoft server in much the same way Google Docs stores documents on Google servers. Also, training would have to be done for teachers / professors learning the web-based PowerPoint in addition to its potential TurningPoint add-on, including an understanding of how they would compare / contrast their desktop counterparts.

Since Excel will be included in the web-based Office, generating reports could export them to the web-based Excel with little trouble. The reports could be viewed anywhere with a high-speed internet connection and appropriate browser. However, training would need to be provided once again in using Excel 2010.

In the end, there appears to be a potential in which this all 'could work.' Whether or not this will come to pass doesn't entirely matter (up to a point), but it still makes for an interesting 'what if?' scenario.

Upcoming TurningPoint Trainings at CIT

Interested in learning about TurningPoint? Perhaps you know nothing about TurningPoint, what it is and how it can be used. Or perhaps you do, yet are unsure of how to use the software, or how to install it on your computer. It very well could be that you are simply interested in learning some of the pedagogical approaches used with clickers.

Whatever the reason, CIT has you covered!

The Center for Instructional Technology is sponsoring two training sessions for any Westfield State faculty interested in the TurningPoint technologies and some correlative pedagogical strategies.

You have the option to attend one of two sessions:

Date: October 5th
Time: 11:30 AM to 12:20 PM
Location: CIT, Wilson Hall 114

Date: October 6th
Time: 11:15 AM to 12:30 PM
Location: CIT, Wilson Hall 114


If you would be interested in attending either of the sessions, please feel free to call me at x8249 or e-mail me at jaxenroth@wsc.ma.edu. The number of seats may be limited, so sign up fast!

Neither of these two sessions work for you? Contact me to schedule a one-on-one appointment to cover your specific TurningPoint needs.

To Grade or Not to Grade?

After some time of using TurningPoint, or clickers in general, one may want to consider providing students with grades. But what is an effective way of grading students using clickers? How will the teacher / professor benefit the most from this? And more importantly, how can students benefit the most from this? Three questions for which answers will have a large impact on student learning.

When considering using grading schemes for TurningPoint, the obvious first step is to be sure you have participant lists for your sessions. It would not make much sense to grade students when you don't know which one has what clicker. However, once we have the participant list, then several issues must be thought through.

Before considering the three questions already posed, let us consider the main question that really matters. What reason is there to grade students using clickers? By using TurningPoint, both students and teachers alike will have real-time assessment of student understanding. However, without grading, there may not be any real incentive for a student to answer truthfully if s/he does not see a reason to. Therefore, by using a grading scheme, there may potentially be a greater incentive for students to answer questions more truthfully.

A drawback may also occur, though. Depending on how clicker use is graded (sometimes referred to as high-stakes and low-stakes), the student may instead have more incentive on answering correctly as opposed to answering what s/he has an understanding of being correct. It has been shown that this results more frequently when students discuss amongst themselves the answers before voting during high-stakes grading schemes. In situations such as these, students will be influenced by peers if they believe the peer has a correct answer without knowing the reason(s) why (students will vote together as opposed to on their own). An analogy to this would be students being influenced by their peers when raising their hands in class in response to a polling question. This will hinder both the professor's and students' perception of student understanding of the material.

As a result, in my opinion, the primary reason to grade the use of clickers is to elicit a more truthful response from students during polling. However, grading should not be enforced to the point where students worry more about being correct in their response than what they learn. Some instructors using grading schemes with clickers provide a base score for answering, and a few extra points for answering correctly (such as 1 point, and 3 points for a correct response). I think 4 points would be a good base, with 5 points for a correct response, weighted for how the clicker grade factors into their overall grade. This will influence students to answer truthfully, but still provide an extra kick for getting it right.

Perhaps the clicker grade collectively could go towards extra credit on various exams and/or projects. Students will then feel encouraged to earn more points, but won't feel pressured into needing a correct response. If using the 4/5 point scheme I just described, the 4 points could maybe go towards participation grading, and the fifth point could be added up in some way for the extra credit.

Just as an example.

There does not seem to be any 'single best' way for grading schemes. However, there are obviously better ways than others. It would appear that keeping low-stakes grading (partial participation credit, with possible extra points for correct responses) works better for students than high-stakes grading ('all-or-nothing' grading).

Students are able to benefit from this because they can receive more points to be added to their grade, without having to stress too much about earning more points. A teacher / professor will benefit since student responses will potentially become more truthful. Both students and professors will then be able to perceive better the class' understanding of the material. Thus, more personalized and accurate discussions and instructions may take place, providing a better learning experience for all stakeholders.

The last step, to make sure you keep track of the grades, is to run and save a report so that the session data isn't lost.

Clickers Beyond the Classroom

From the start of this blog, the primary focus of using TurningPoint has been its use within a classroom setting.  In fact, one common name for clickers is 'classroom response systems.'  However, audience response systems are much more than that, and are not beneficial only in the classroom environment.  Use of TurningPoint has increased at Westfield State outside the classroom, such as committee meetings, conventions, and campus events.  Whereas using clickers inside the classroom can be used to foster increased student learning, this benefit may not be so relevant outside.  So, what benefits may be found in using TurningPoint clickers in these other areas?

First and foremost, TurningPoint is an audience response system--it allows the whole audience to respond to the presentation, in real time.  In cases such as conventions, the audience may be relatively large.  How can you not just quickly, but also easily, receive a response from two hundred people in a large room and make use of it instantly?  When using TurningPoint, posing an opinion-based multiple choice question will let the presenter know the general consensus over an issue being discussed, while it is being discussed.

For conventions and campus events, this can be incredible useful.  In the classroom, you may (though not necessarily) know at least some of how much your students understand the material, or what they may think about it.  It is much harder to gauge this understanding in a room full of strangers.  Members of the audience themselves also will not fully know how their opinion compares with those around him/her.  However, when asked for an opinion using TurningPoint, after the polling ends, the presenter and audience all will have a basis.

It is entirely possible, and even likely, that the presentation and feedback from the audience will not just benefit from having TurningPoint collect and portray this information in real time, but a means to allow the feedback to be discussed is fostered.  This scenario happened recently with one of Westfield State's committees.  Scenarios were presented to the members of the committee, and each member had a clicker to respond whether they agreed, disagreed, or were neutral.  For topics in which member responses were disparate, open discussions were allowed to offer suggestions on how to improve the scenario in question.

Whether in the classroom, a committee, or nearly anywhere else in life, there will be those who tend to be very vocal in expressing their opinions, while other may have very strong opinions but have trouble being vocal about them.  With TurningPoint, everyone has a voice, and all of those voices are heard.